In order to be a professional author, to make enough money to live off your art, you need to treat your writing career with the same respect and diligence as you would any other type of business. Though it is possible to make money following intuition alone, it is very difficult to make consistent profits off feelings and hunches. For me, it seems like putting on a blindfold and stumbling around hoping to fall into a pot of gold.
Instead, businesses need to be able to quantify their success or failures objectively in order to make informed and useful decisions. Large corporations hire fleets of analysts to do this work for them. However, don’t let the math intimidate you! Writers, especially indie authors, typically don’t have nearly enough data to need someone devoted to the math. Additionally, there have been some very smart people who have already done most of the work for you. All you really need to do these days is to know which tools to use and which numbers to pay attention to.
Even still, I know how trying to dig into data can be intimidating. However, if you break the process down into 5 easy steps, it all becomes a whole lot more approachable.
STEP 1: DEFINE YOUR PRIORITIES
The first thing you need to do when approaching any statistical analysis is define what you care about. There are ways to quantify just about anything you want to know. In fact, sorting the useful information from the noise is often the hardest part of any analysis. Approaching your pile of data with specific questions will help you get specific answers. So, what is it that you hope to get out of your career as an author?
STEP 2: PICK YOUR TOOLS
There are tons of statistical tools choose from. Some are more intuitive than others, some more flexible, and yet others more comprehensive and powerful. Unfortunately, the more powerful the tool, the more difficult it is likely to be to use, and the more interpretation the results will require. Though it is a constant give and take, there are a few pieces of software that I think achieve a good balance and that I would recommend even for people who hate math.
One of my favorite pieces of statistical software is Google Analytics. I believe it to be one of the more powerful, flexible, and user friendly options available. Most importantly, it is free. After all, Google is the company made their fortune off being able to quantify the Internet. So, it only makes sense that their statistics software would also be top notch. Need help installing and configuring the software? The Google Analytics community is fairly robust. I’d recommend starting HERE. On the other hand Google Analytics has a lot of data and power. It can get quite involved and distracting if you let it. Be cautious as obsessively monitoring every page view can easily become a time sink.
Additionally, if you use Word Press for your website, I’d also recommend installing Jetpack. It comes with all sorts of useful widgets, one of which is a basic statistics program. Though you won’t be able to do any manipulation or dig into the data very far, it’s often good enough to give you a general idea.
Finally, most publishing platforms come with some sort of basic statistics modules. This will allow you to track sales, geography of purchases and several other metrics. One of the limitations here is that you track exactly what the distributor allows you to track. Almost always, their statistics are better than what you are given access to.
STEP 3: TAKE A STEP BACK, WAIT, AND LOOK FOR PATTERNS TO EMERGE
Chances are that you already have an audience that is interacting with your web page. So, the very first thing that you’ll need to do after installing any new statistics software is to allow for time to pass. Initially, I’d recommend continuing as you were for three weeks to a month so you can get a feel for how your business runs before you make any changes. Without a baseline, you’ll have no idea what is “normal” behavior and what is a reaction to a change you make. I’d also recommend establishing a new baseline each time you make a major alteration to to your business strategy.
Once you get to the point where you start running social experiments (Step 4), you’ll need to be willing to take a step back from the keyboard. Statistics takes patience. You can’t reasonably expect your consumers to respond immediately to your actions. Also, the initial reaction of a consumer group isn’t necessarily going to be their long term response. I’ve spoken to several indie authors who have tried raising the price on their books only to see an immediate drop off in sales. At that point, many of them lowered the unit price in a panic and swore they’d never ask for more money. However, *some* of the authors who stuck it out and let their new price stand for a few months noted that their sales returned back to their original baseline or even increased! Patience is key. So is being willing to risk and knowing how much you are willing to risk.
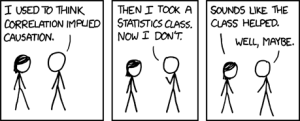 SOURCE: http://xkcd.com/552/
The bulk of statistics is finding the long lasting, consistent patterns in the noise. You want a change you can believe in. Just because you see a big spike, doesn’t mean that one event was caused by the other, nor can you even say that the spike is significant. Let’s say you spend $100 on advertising and sell 15 more books than your baseline sales. The next week, you spend another $100 and sell 2 more books than your baseline sales. Chances are that there is some deeper explanation in the first spike that differentiated it from the second. Any consumer group is going to have patterns in how they choose to spend their time and money. Find those patterns that represent a real response and you’ll be able to take advantage of them.
Let’s take my own website, www.NathanBarra.com, as an example. When I first looked at my own baseline, I noticed spikes of activity first thing in the morning, for a couple hours around lunch time, and in the evening. Additionally, I tended to see a spike in views on Mondays. Over the course of the week, the number of page views slowly died out until no one visited over the weekend. These patterns repeated over a the course of the month, so I had faith that they were a true look at my audience. Once I had the baseline, I needed to understand what the patterns meant.
STEP 4: INTERPRET THE PATTERNS
Now it is time to go back to the goals we established in Step 1. Are you into writing to make money? In that case you should be tracking the Number of Units Sold and how many visitors Click Through from your website to a point of purchase. Additionally, you can gain some insight if you pay attention to your Audience’s Geographical Origin. If you plan to do a book tour, make sure you go to the places where you have lots of fans. If you have no readers in a particular region, try to find out why. Are your marketing dollars beings spent to reach the widest audience possible? Are your books even available to that audience? Do you need to devote more advertising money to that demographic? Additionally is your marketing proving effective? Do you see any spikes up to a new plateau or steady growth in purchases following a marketing push or promotion period?
Are you the kind of writer that just wants to get your stories in front of as many eyes as possible? Then focus on driving up the Number of Visitors (number of unique individuals that loaded any page on your website) and Number of Page Views (the number of total pages that were loaded). When combined with your web site’s Bounce Rate (the percentage of visitors who look at exactly one page before leaving), you can understand how your readers interact with your website. Additionally, you want to pay attention to your largest sources of visitors, particularly your referrals. These days, much of your audience will likely come from somewhere else, be it social media, Google, or a link a friend emailed them. These people are your Referral Visitors. They represent how often and how widely your links have been shared. If you can understand your biggest sources of referrals, you can know where to focus your efforts to get the biggest return.
Instead, are you trying to build a steady and faithful audience? If that is the case, you need to encourage Repeat Visitors (people who have been to your page before) and Organic Visitors (those who typed your URL into their browser directly). You want the ratio of repeat visitors to new visitors (called your audience’s Rate of Return) to be as high as possible while you minimize the Days Since Last Page View.
Keep in mind that you won’t often be able to manage to make progress on all your goals simultaneously. When I first started NathanBarra.com, I wanted to get my page out in front of as many readers as possible, with the long term goal of establishing a steady audience. To that end, I started experimenting.
STEP 5: DESIGN AN EXPERIMENT AND RETURN TO STEP 3
Now that you have an idea of what “normal” is and what it means, you want to try to rock the boat a little and see what sort of waves you can make. Going back to my NathanBarra.com example, the first thing I did was change the amount of lag that I allowed between when I scheduled a post and when I first advertised it to my target audience. In the beginning, I saw that almost all my audience came from referrals that occurred after my media blast. I then went back posting and advertising near simultaneously. After a while, I started to wonder if I had become better established with a larger group of readers. I once again started delaying my media blasts and found that I had a steady flow of readers visit my page after I posted, but before I advertised. The things I had been doing to boost my audience had been working!
The key here is to change as little as possible and to wait long enough to observe meaningful results. If I were to spend see a spike in sales after a blog tour during which I also ran a BookBub campaign, which source of advertising should I focus on next time? There’s no real way to know.
Once you’ve made a change, return to Step 3. Wait, gather data, and then interpret the results. I would always recommend repeating any experiment at least twice. If you repeat your actions and see the same result, you can be confident that what you are seeing is real. If the results are different in consecutive experiments, then try to find out what is really causing your audience to react the way they did. Additionally, you need to take time to evaluate if the change you made supports your goals. If so, consider permanent implementation. If not, lesson learned, don’t do it again.
The key to any good statistical analysis is good interpretation. Take your time to think through all the possible reasons for the change, suing your experiments to hone in individual elements and actions. The longer you work at it, the more you’ll be able to determine from your results. Eventually, you will be so in touch with your audience that the statistics will just be a spot check to ensure that your audience is reacting the way you expected they would. Once you get to that point, you’ll understand why businesses focus on the numbers and leave the hunches for the amateurs.
About the Author:
Though Nathan Barra is an engineer by profession, training and temperament, he is a storyteller by nature and at heart. Fascinated with the byplay of magic and technology, Nathan is drawn to science fantasy in both his reading and writing. He has been known, however, to wander off into other genres for “funzies.” Visit him at his webpage or Facebook Author Page.

 Ever feel like a needle in a haystack? Perhaps more accurate, a needle in a huge pile of other needles. We write, we publish, we go to conventions and yet somehow reaching readers seems to become more and more difficult. Perhaps they feel inundated by the “buy me” media, they have their favorite authors and have difficulty branching out, or they just plain don’t realize how much they need our books. What can we possibly do to even have a chance at the love and authorly acceptance we so desperately crave…along with a few more book sales, please?